
The InSAR Feasibility Tool
The InSAR Feasibility Tool
1. Introduction
Satellite InSAR (Synthetic Aperture Radar Interferometry) is an active remote sensing technique for ground deformation monitoring. A-DInSAR (Advanced Differential InSAR) processing techniques in particular can be used to obtain time series of displacement of both the ground and structures (such as: outcropping rocks, buildings, slopes, etc.) reaching millimetre accuracy (Ferretti et al. 2000, 2001; Kampes et al. 2006). The approach is based on multi-image analysis that supports estimation and removal of atmospheric noise. The basic requirement for the application of A-DInSAR techniques is the availability of a good number of multi-temporal SAR images acquired over the same area.
The availability of SAR images is determined by the acquisition plans of different satellite missions that have operated since the early 1990s. Over the last few years, an increase in the number of satellite missions has provided an opportunity to perform A-DInSAR studies at a global level. However, at the same time, the search for imagery in the archives of the different operators has become more complex and time consuming. In order to address this challenge, NHAZCA S.r.l. and Geocento Ltd have jointly developed the InSAR Feasibility Tool, a web based platform capable of quickly assessing the availability of satellite images suitable for A-DInSAR analysis (i.e. interferometric stacks). The users can use the tool to assess the feasibility of A-DInSAR analysis according to the availability of satellite SAR data.
2. Satellite InSAR Overview
A-DInSAR is a powerful technique able to measure and monitor surface displacements of the ground and structures over time, reaching millimetric accuracy, for those measurement points characterized by high intensity and stability of the backscattered signal (Ferretti et al. 2000, 2001, 2011; Berardino et al. 2002; Kampes et al. 2006). A-DInSAR is a multi-image processing approach suitable for both wide areas (thousands of square kilometres) and small areas (i.e. single slope or structure), with the capability of providing time series of displacements of the observed targets. A-DInSAR is based on the Differential InSAR technique (DInSAR). This technique exploits the information contained in the phase of the signal of two complex SAR images acquired in different times over the same area, used to form the so-called interferogram (Crosetto et al. 2016). The interferogram is computed by cross-multiplying the first SAR image with the complex conjugate of the second (Ferretti et al. 2007). The resulting interferometric phase (φint) is the phase difference between the two images, with the following contributing phase elements:
φint = φtopo + φflat + φdisp + φatmo + φerr (1)
where φtopo represents the contribution related to the topography, φflat represents the flat Earth phase component due to different look angles of the two acquisitions, φdisp is the contribution related to displacement, φatmo is the phase related to different athmospheric conditions and φerr represents the error related to uncontrolled effects (e.g. decorrelation, position along the satellite orbit, etc.).
The differential interferogram is formed by subtracting the φtopo and φflat contributions from the interferometric phase, by using a reference DEM (Digital Elevation Model) and a reference ellipsoid respectively, thus allowing retrieval of the phase component related to displacement. Figure 1 shows an example of a Sentinel-1 (European Space Agiency) differential interferogram, related to the co-seismic interval of the Norcia earthquake (30th October 2016, Norcia, Central Italy).

Figure 1. Sentinel-1 interferogram of the co-seismic interval related to the Norcia earthquake (30th October 2016, Mw 6.5, 42.84°N 13.11°E, 07:40 local time).
To generate the interferogram shown in Figure 1, two SAR images were acquired on 27/10/2016 and 02/11/2016 from an ascending orbit pass (i.e. passing from South to North looking in the right direction). The deformation produced by the earthquake is highlighted by the presence of the so-called “interferometric fringes”. The colour cycle of one fringe (from red to blue) corresponds to a displacement of half of the wavelength. Thus, considering the characteristics of the Sentinel-1 satellites, one fringe corresponds to a displacement of 2.8 cm in the Line Of Sight (LOS) direction.
DInSAR does not allow the estimation of φatmo component, but this can be removed by means of the A-DInSAR technique. A-DInSAR methods exploit multiple SAR images acquired over the same area, isolating φdisp from the other phase components using suitable data processing algorithms (Crosetto et al. 2016).
The main products of an A-DInSAR analysis are (a) the time series of displacement and (b) the average velocity, that can be estimated over the measurement points characterised by a persistent (PSs - Persistent Scatterers) or distributed (DSs – Distributed Scatterers) backscatter behaviour (Ferretti et al. 2000,2001,2011; Perissin & Wang 2012) (Figure 2). It is worth mentioning that the displacements are measured along the LOS, i.e. the path direction between the sensor and target. In Figure 2 an example of A-DInSAR result is reported. The analysis was carried out by processing 46 COSMO-SkyMed images acquired over the time period between 2011 and 2015. The images were acquired in the Stripmap mode, characterised by a resolution of 3x3 meters in slant-range and azimuth. In Figure 2, the settlement processes that were affecting the road (red points) are clearly observable, characterized by an average velocity trend of about 10 mm/year.
Its capabilities and peculiarities make the InSAR technique a suitable and powerful tool for several applications such as monitoring of subsidence processes (e.g. due to oil and gas extraction or water extraction), slope stability assessment, structure/infrastructure monitoring (i.e. dams, buildings, highway, viaducts, etc.), tunnelling-induced ground deformation monitoring, land use planning and monitoring of volcanic and seismic activity.
In order to retrieve the time series of displacement, a minimum number of 15–20 images collected with the same acquisition geometry is required (Crosetto et al 2016). Furthermore, the larger the number of available scenes the better the quality of the average velocity estimation and time series of displacement. A collection of images that can be processed together using A-DInSAR methods is called an interferometric stack.
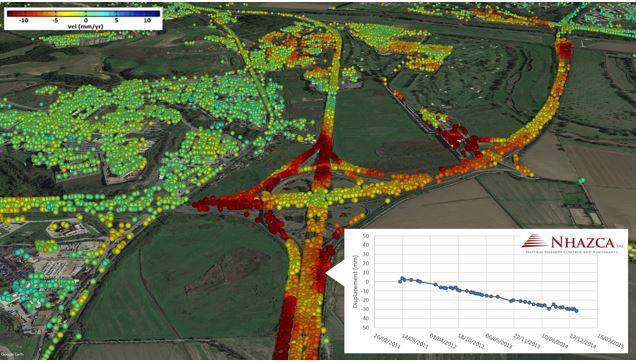
Figure 2. Example of A-DInSAR results from COSMO-SkyMed images. Each measurement point is a PS and its colour indicates the magnitude and the direction of the average velocity (in mm/year) along the LOS. Yellow to red colours indicate movements away from the sensor, while light blue-blue colours indicate movements toward the sensor. Green points are considered as stable.
...continua la lettura nel pdf
articolo a cura di ![]() e
e 
NHAZCA S.r.l., Spin-off di Università degli Studi di Roma “La Sapienza”